Individual Engagement Graph
Edited
Understand how your recipients are engaging with your videos with the help of the engagement graph. This simple bar visualization can help identify moments of high and low interest manifested as rewinds or skips.
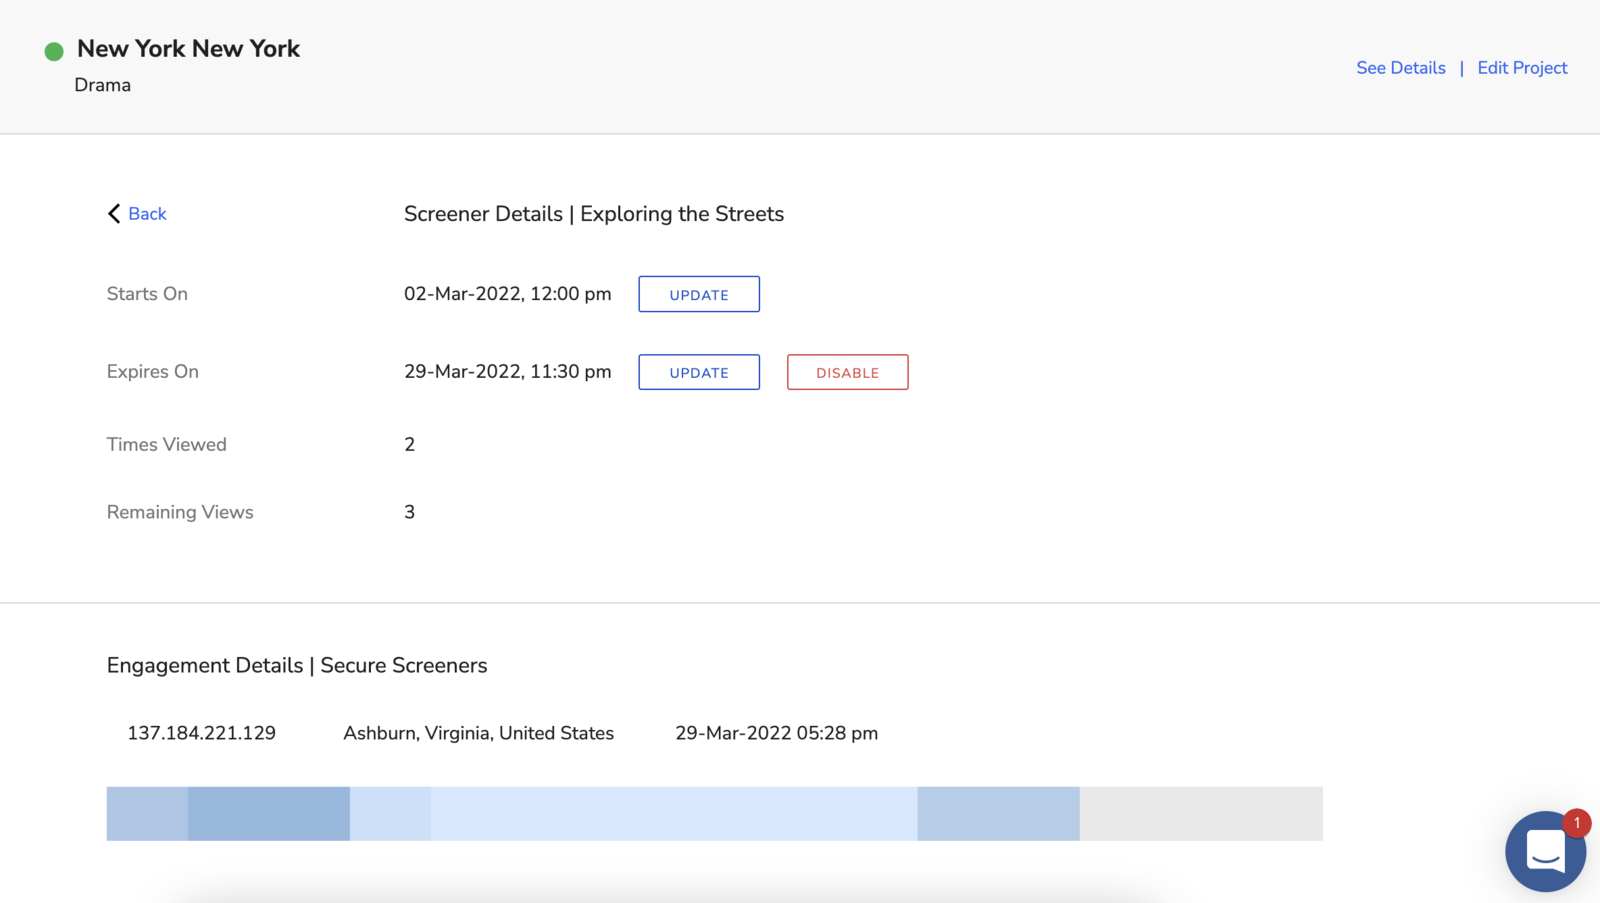
To access the engagement bar, head to the Screeners page within your project > click on a screener room listing > select a video within the screener room.
In the bar above, the lightest blue sections indicate a single view. The darker blues indicate a higher number of views on those particular video sections, and the gray sections indicate skips. While this may provide little insight on an individual level, once cumulated, this information can be extremely powerful.
engagement
analytics
Was this article helpful?
Sorry about that! Care to tell us more?